
What in the F-gases..?
How Retail Refrigeration and Rapid Growth in Developing Nations Drive the Rise of F-Gases

👋 Hey Akshar here! Welcome to 14 new subscribers who joined since the last post! Factorial is a growing community where you get to learn and engage with data science. Every week, I choose to explore a topic and tell a story about it using data, and this week’s topic is F-gases!
Fluorinated gases (F-gases) don’t get nearly the attention that carbon dioxide or methane do—but they should. They’re used in everything from air conditioners to supermarket freezers, and their global warming potential is off the charts. I put together an infographic to explore who’s emitting the most, how it's changed over time, and why the retail sector plays such a big role.
Most of you might remember learning about the ozone layer and its depletion due to CFCs. F-gases like HFCs were introduced as replacements for ozone-depleting substances such as CFCs and HCFCs. While they helped protect the ozone layer, they quietly introduced a new problem which was their extremely high global warming potential. That history helps connect the dots between an environmental crisis we solved and a climate challenge we’re still confronting
This article was originally an infographic and not a long-form essay. But since Substack doesn’t support infographics natively, I had to deconstruct it into something scrollable. You can click on the image or here to view the infographic in more detail.

When turning this infographic into an article, I realized just how much the placement of graphs shapes how we interpret a story. In an article, you can guide the reader linearly, one paragraph at a time. But with an infographic, everything is visible at once. That means structure does a lot of heavy lifting.
Colors were a design decision I didn’t want to get lazy with. It’s tempting to use greens and blues because they look clean and great for environment topics, but for something as damaging as F-gases, that felt misleading. So I pushed those hues slightly cooler and darker. The colors still signal environment and atmosphere, but without the comforting connotation.
Here is the article form of the infographic:
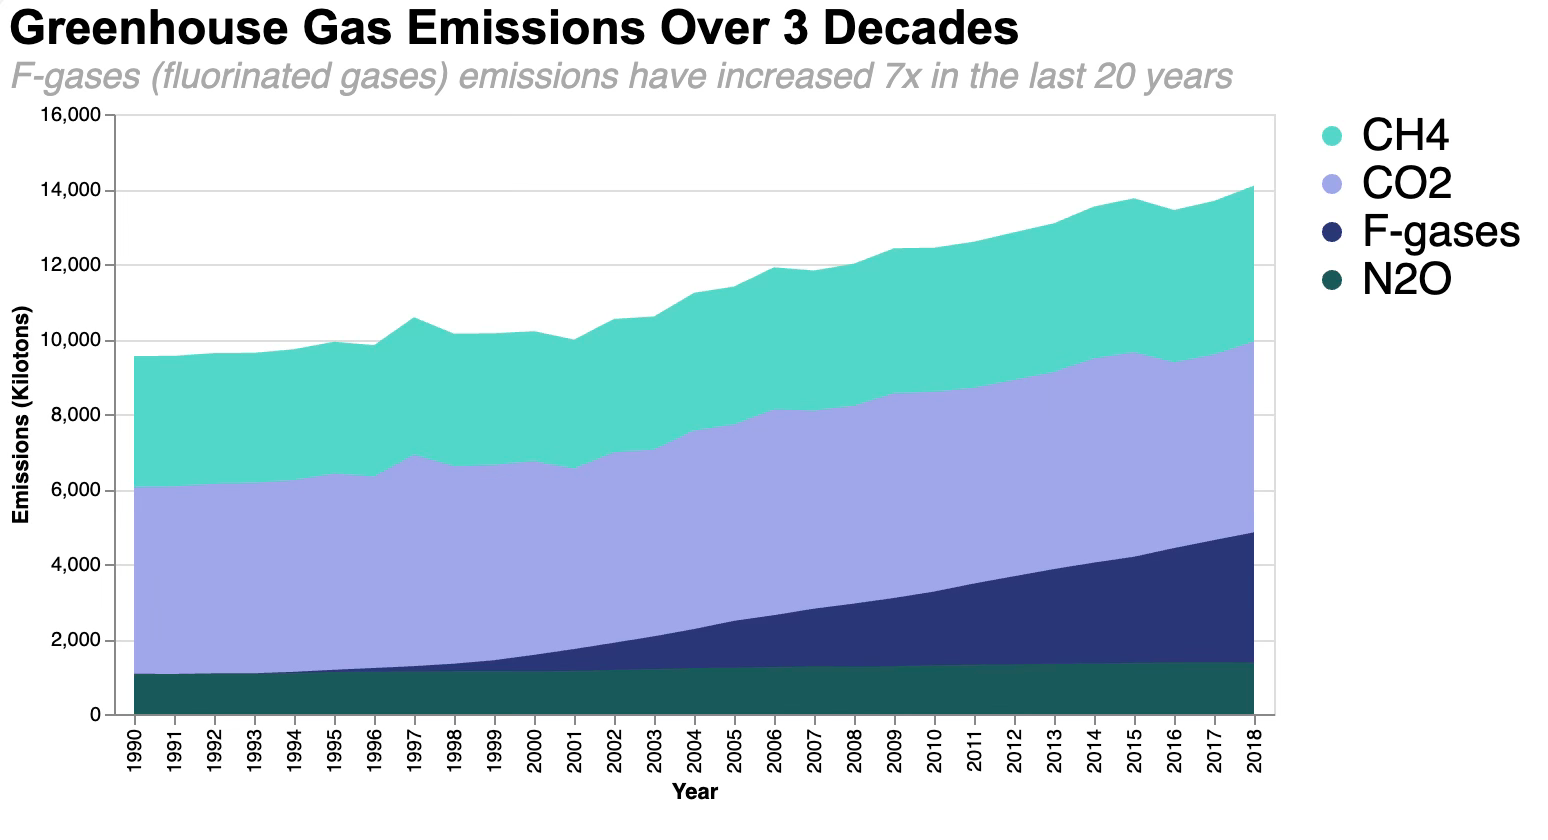
Fluorinated gases (F-gases) are potent greenhouse gases commonly used in industrial applications, refrigeration, and air conditioning. Emissions have been on the rise, with F-gases significantly impacting the atmosphere by capturing carbon and exacerbating climate change. This growing trend underscores the urgent need for targeted international mitigation efforts to curtail their increasing influence. As we seek solutions, we must ask: which corner of the industry is this emerging from?
The clue is at the Retail end of the Distribution
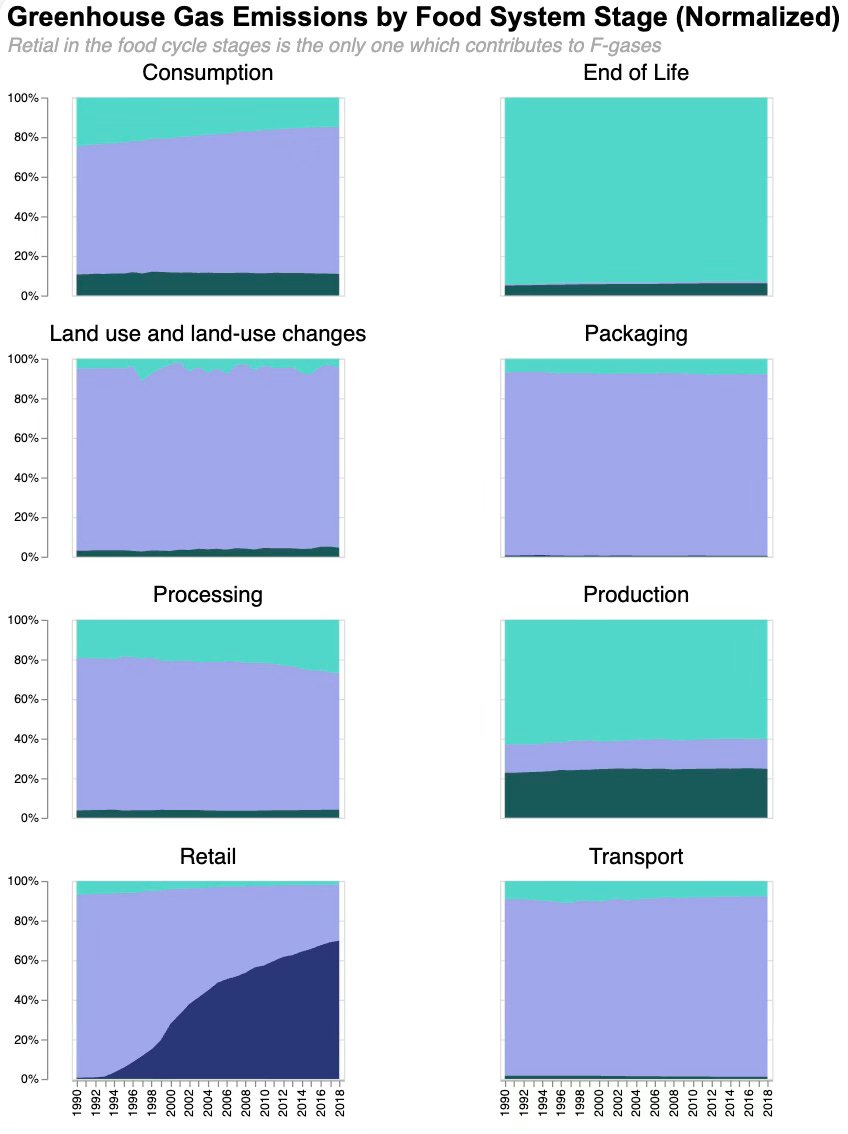
Changes in retail, driven by technological advancements and consumer preferences, have significantly increased emissions of fluorinated gases (F-gases). The expansion of supermarkets and convenience stores has led to a greater reliance on refrigeration and air conditioning systems, which often use hydrofluorocarbons (HFCs). Additionally, the growth of cold chain logistics and increased imports necessitate more cooling, contributing to higher F-gas emissions. Modern consumer habits favor convenience, resulting in greater consumption of processed foods that require refrigeration. Furthermore, outdated and inefficient refrigeration systems in many retail establishments lead to leaks. Although regulations are tightening, the legacy of existing systems continues to impact F-gas emissions, highlighting the need for sustainable practices in the retail sector.
The Emissions Pie is not cut Equally
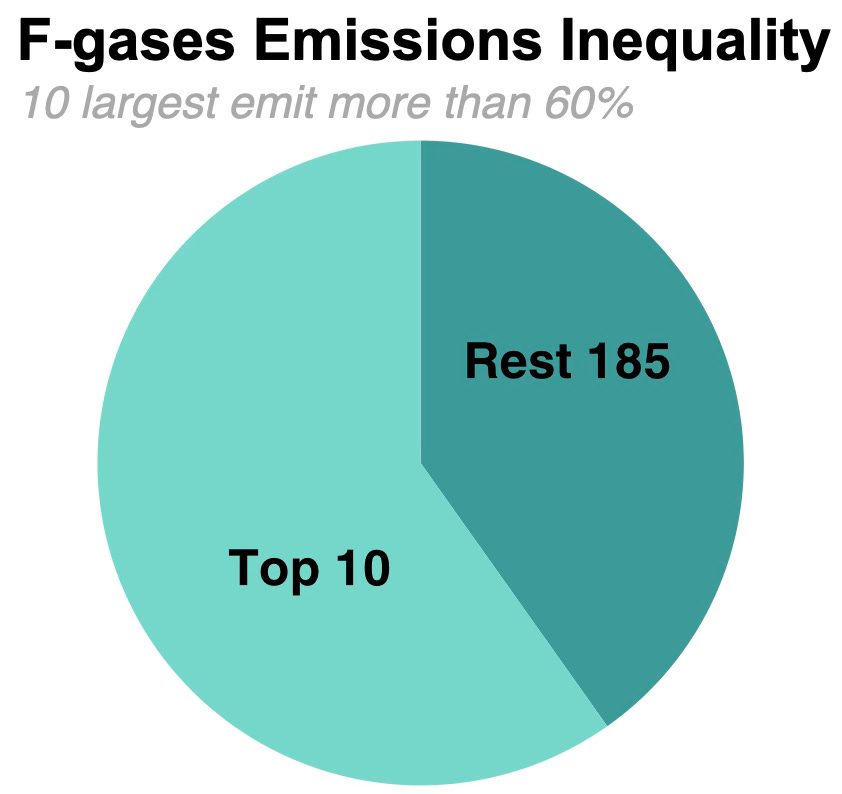
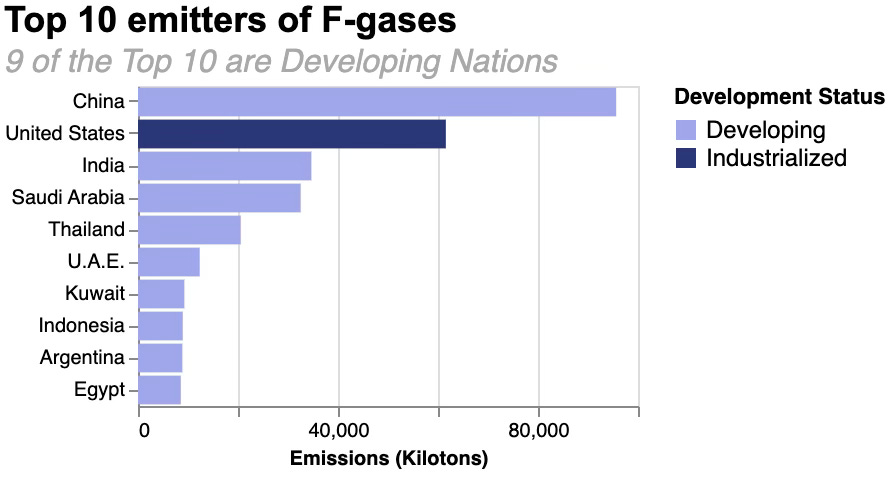
F-gas emissions are highly skewed, with the top 10 nations contributing 60% of global emissions. Interestingly, only one industrialized nation appears among these top emitters; the rest are developing countries. Notably, populous countries such as India, China, and Indonesia are significant contributors, underscoring the impact of large populations on total emissions. While absolute emissions are important, it is essential to evaluate emissions per capita to provide a fairer assessment of environmental impact. This perspective emphasizes that addressing emissions must balance accountability with understanding population-driven contributions and the differing economic capabilities between industrialized and developing nations for sustainable solutions
Developing a Divergence

From 1995 to 2004, developing nations showed a clear trend of increasing per capita F-gas emissions, reflecting industrial growth and expanding economies. However, an interesting shift occurred in 2004 when per capita emissions stabilized for approximately a decade. This period of relative stability might suggest the influence of international agreements, technological shifts, or policy measures aimed at limiting emissions. Around 2014, the trend changed again, with emissions in developing nations beginning to diverge from those of industrialized nations. While industrialized nations maintained stricter controls and reduced emissions per capita, many developing countries saw a resurgence, driven by economic expansion and less stringent regulations
Ending on a hopeful note
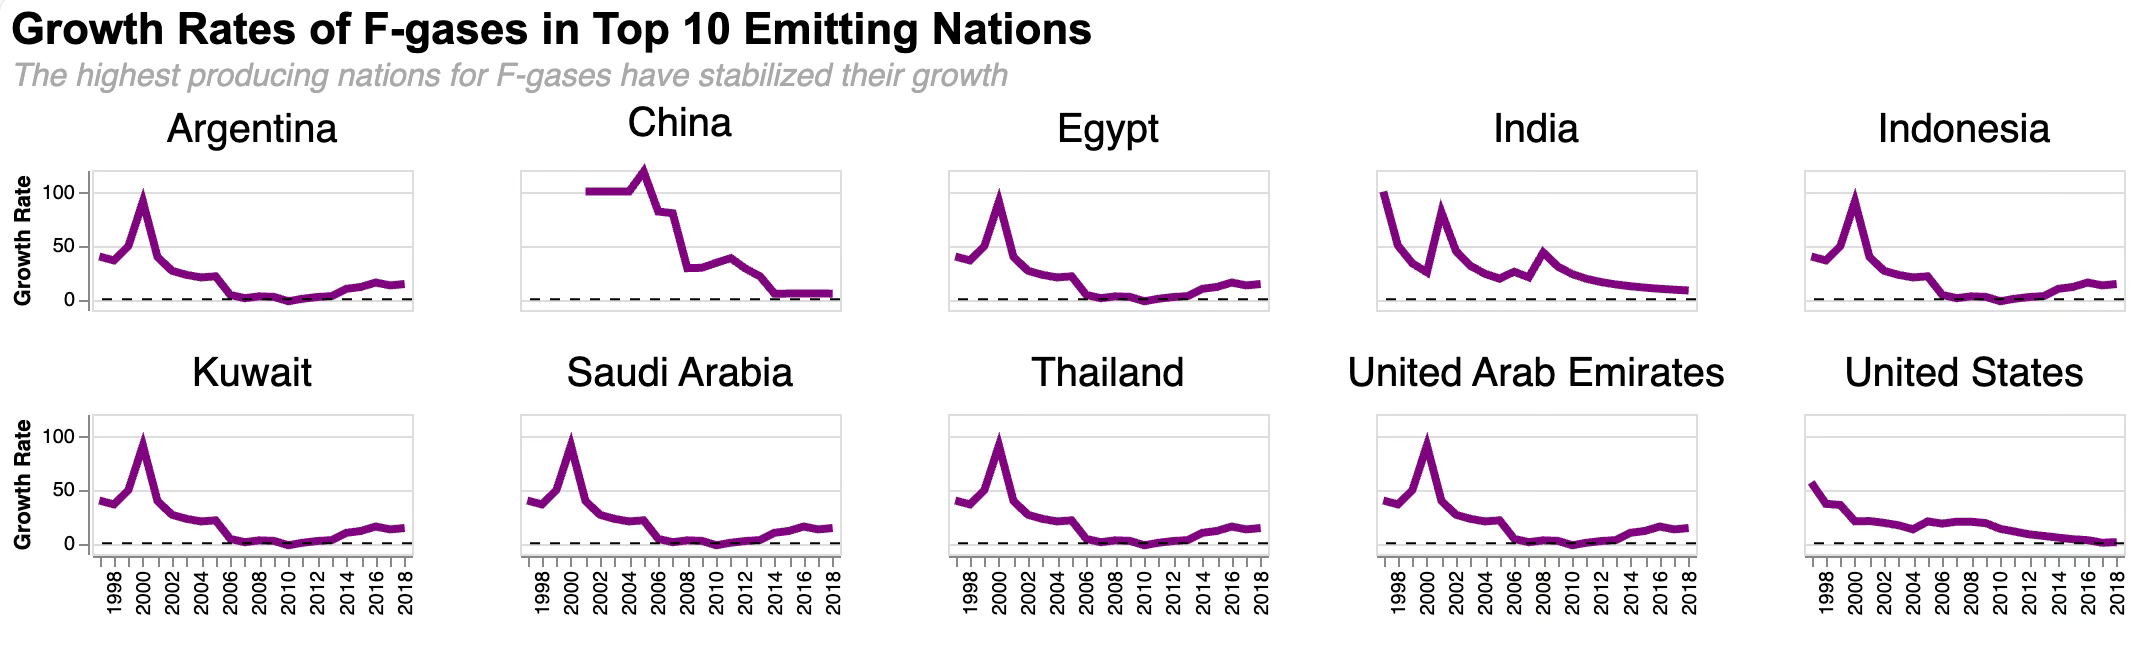
Top emitters that previously experienced growth rates of 60-90% in emissions have now significantly slowed, averaging only 5-10% growth, reflecting a stabilized situation that can be controlled by emission reduction efforts.