


Brewing up Data
Where does great coffee come from? Sip on coffee stats and figures in this post

👋 Hey Akshar here! Welcome to 22 new subscribers who joined since the last post! Factorial is a growing community where you get to learn and engage with data science. Every week, I choose to explore a topic and tell a story about it using data.
2 Billion cups of coffee are consumed daily! Some like these cups served plain and simple. While others like to know the flavour profiles, its origin, type of roast, and other scrupulous information with it. They treat it like the psychostimulant it is.
This does no good for me. When faced with such an extensive array of information, the agony of decision-making makes the coffee experience less than ideal.
So, in the interest of knowing more about the various parameters of coffee, I decided to learn more about it in the best way I can - using data!
I found original data from the Coffee Quality Institute headquartered in California which was published on Kaggle. It collects information about coffee plantations across 22 nations. Most of these nations are from the Coffee Belt.

Coffee quality is measured using these definitions in the dataset:
Aroma: Refers to the scent or fragrance of the coffee.
Flavor: The flavor of coffee is evaluated based on the taste, including any sweetness, bitterness, acidity, and other flavor notes.
Aftertaste: Refers to the lingering taste that remains in the mouth after swallowing the coffee.
Acidity: Acidity in coffee refers to the brightness or liveliness of the taste.
Body: The body of coffee refers to the thickness or viscosity of the coffee in the mouth.
Balance: Balance refers to how well the different flavor components of the coffee work together.
Uniformity: Uniformity refers to the consistency of the coffee from cup to cup.
While the ideal coffee is a delicate dance of all these parameters, I decided to be more rational than romantic and chose the 3 which matter to me the most — Aroma, Acidity and its Overall score (average of all these scores).

Of the top 5 countries with highest coffee quality, the top 4 are from Africa. This fact intrigued me, and I decided to look at evidence which might explain this.
First off, Africa is regarded as the birthplace of coffee. Ethiopian highlands are indigenous to most species of coffee. Its use as a popular beverage happened due to colonialism. Dutch, English and Spanish conquistadors introduced coffee to be cultivated as cash crops which replaced a lot of diverse crops for large plantations of coffee.
Due to its deep history with the crop, African producers are cognizant of the environment that supports their crop, and practise sustainable farming methods to preserve the complex ecosystem.
Roughly 80% of all coffee produced in east Africa comes from smallholder farms. Cultivating on relatively small holdings of land allows them to diversify their crop to ensure a more resilient yield.
Now, let’s look at the worst coffee of these 22 countries in terms of their overall scores.

It’s interesting to note that all of these countries belong to Central/South America. So here’s the burning question: What is it about African coffee that Latin America is impervious to?
This time, I decided to explore the question within the dataset. I compared the worst coffee countries with moisture levels of those regions, and found that all of them originate from high-humidity regions.
High humidity interferes with the drying and roasting process of the coffee cherries by way of increased risk of mold and bacteria. High moisture levels also lead to uneven roasting which compromises the quality of the bean. It can lead to off-flavours and flatness.
Look at the relationship between coffee quality and moisture levels.
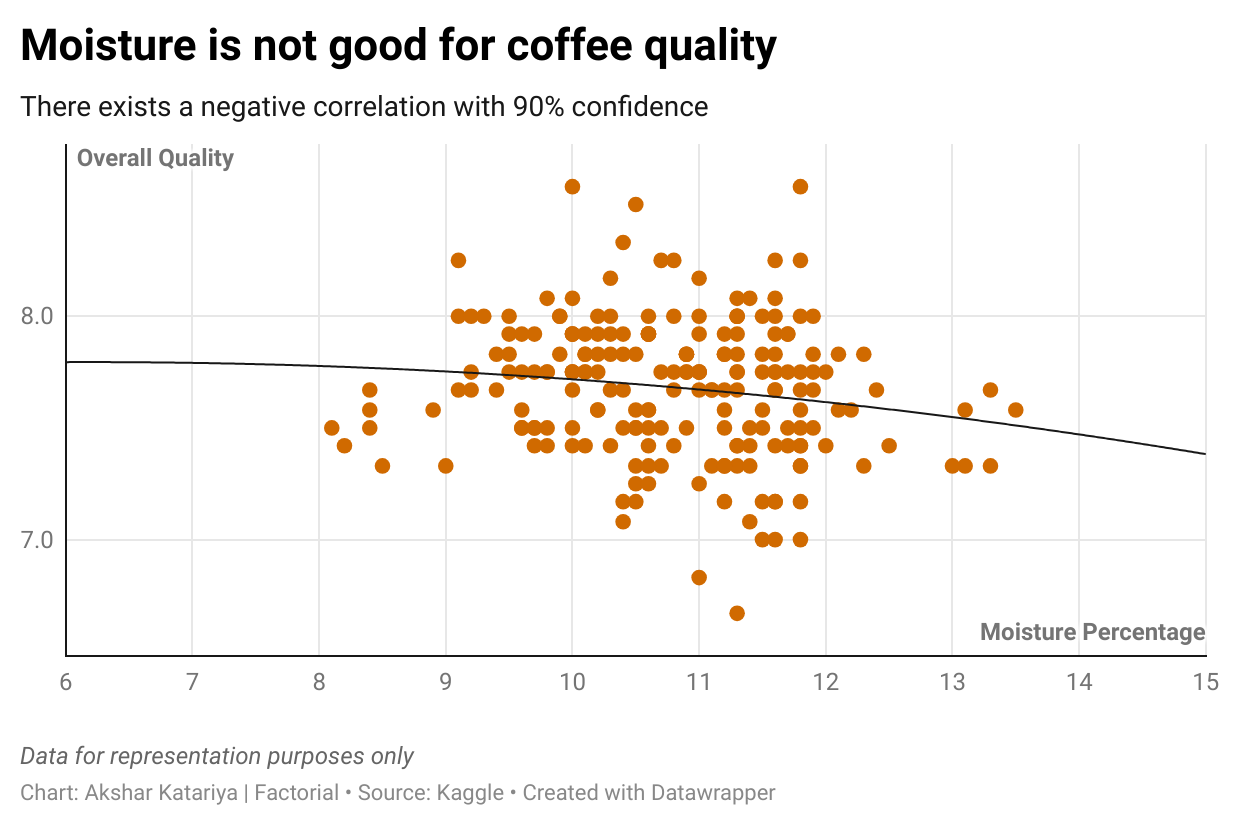
The line here is a quadratic fit.
Quadratic fit helps find the best curve (like a U-shaped parabola) that matches a group of data points. It's useful for understanding and predicting relationships between things.
It is evident from the graph that maintaining an ideal moisture level is crucial for ensuring the quality of the bean, its flavour and shelf-life.
Exploring coffee using data was really fun, it unveiled patterns and relationships, flavours, regions and their landscapes. It also made my overly caffeinated brain more coffee-literate.
Now, for you folks who have made the effort to read all the way till here, here’s a BONUS graph!

Use this guide the next time you are buying coffee, and feel free to send a box over too ; ) Please drop a like if you liked the analysis and the graphs, I’d really appreciate it.
A breezy, aroma-filled read, perfect for early morning!