


Artistry of the Windy City
Exploring the vibrant artistry of murals in the city of Chicago using some data, some intuition, and some good ol' spirit of exploration.

This is the 16th edition of my newsletter, and it comes with a personal and professional update: I have moved to Chicago to begin graduate studies at the University of Chicago. This place is exciting. This move has unclogged the fountainhead of ideas I had for the newsletter. So, this post will be about the city of Chicago, its beautiful murals, and its disparities, packaged neatly in Dataviz.
I live in Hyde Park, a historic neighbourhood in the south side of Chicago. Almost all buildings here have an open-brick facade with vines creeping upon them. It's beautiful, especially during the fall season right now.
The south side of Chicago is a paradox. On the one hand, it has so much to offer for 'flaneuring', but one has to always exercise caution, more so here than in other cities.
Look at the city's racial distribution as a result of the discriminatory housing policies. Even though these policies have long been abolished, the legacy of this separation continues to reflect, not just in demographics but also in economics. The south side has been overlooked for too long.
The city council here has data about almost everything. I found a collection where they had the geolocation of every mural registered with the city council. I couldn't wait to jump in on the data. So, let's explore the murals in the city of Chicago using data!

It was surprising to see that most of the murals were installed in the last decade because they are not a new-age art form. However, upon further research, I found that even graffiti over a specific size qualifies as a mural and could explain some of the recency in the results.
Another surprising finding was the location of these murals. Since it's culturally denser, I had intuited that most would be situated on the south side. However, to my surprise, it was the complete opposite.
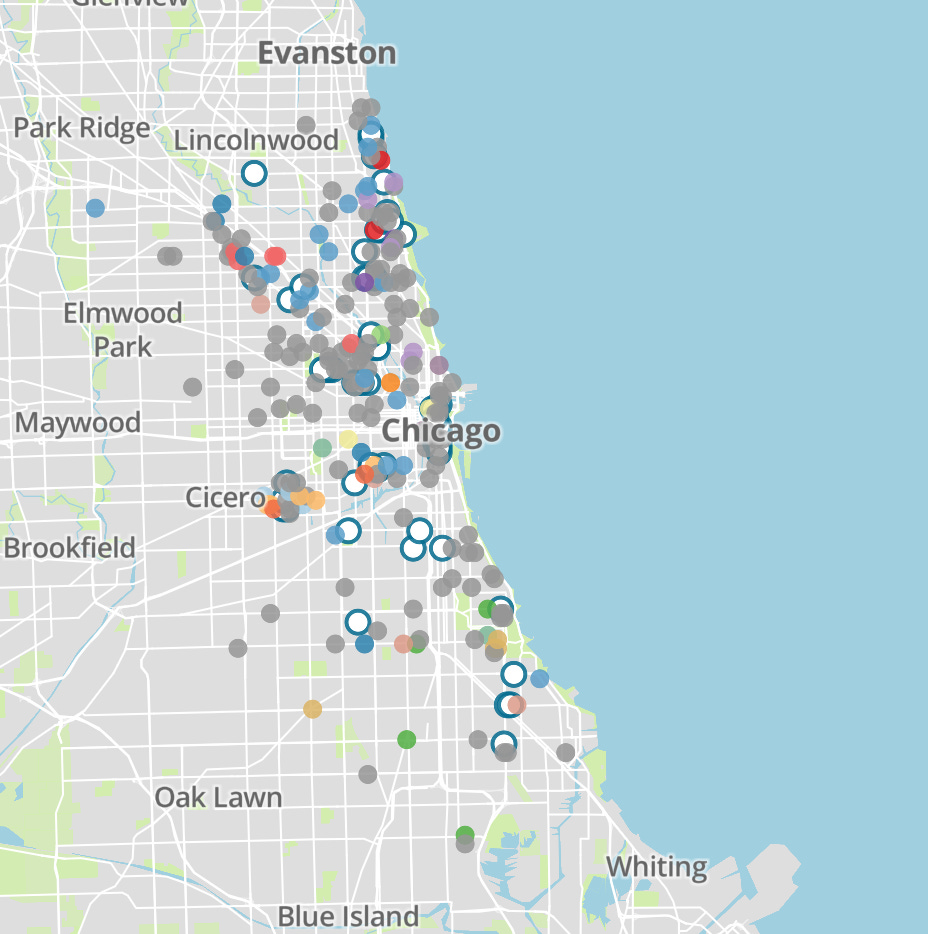
The city centre and the northern sides had more concentration of these murals. This often happens in data analysis where what you intuit is proven wrong. But this cloud of dismay is outlined by the silver lining of context. Showing data is one thing; explaining it is another part of research. It could be that the artists don't want their art registered with the city council.
This could be because of the threat of censorship, or it could also be borne out of anti-establishment movements as a response to the city council's discriminatory policies. If this were the case, then the timeline would show a trend. It would look like a downtick of sorts in a particular year. However, we see no such evidence when the southside murals are filtered in the distribution (look below).

These are very abstract themes and can't be statistically backed as it is hard to measure and collect data about them. The point of this essay is not to justify/nullify the data but to give you an empirical account of the situation.
It could also be explained by the cultural hotspots in the northern side, like Pilsen, which, BTW, is rich in Latino culture. In fact, the Pilsen area on the map boasts many murals as opposed to neighbourhoods around it.
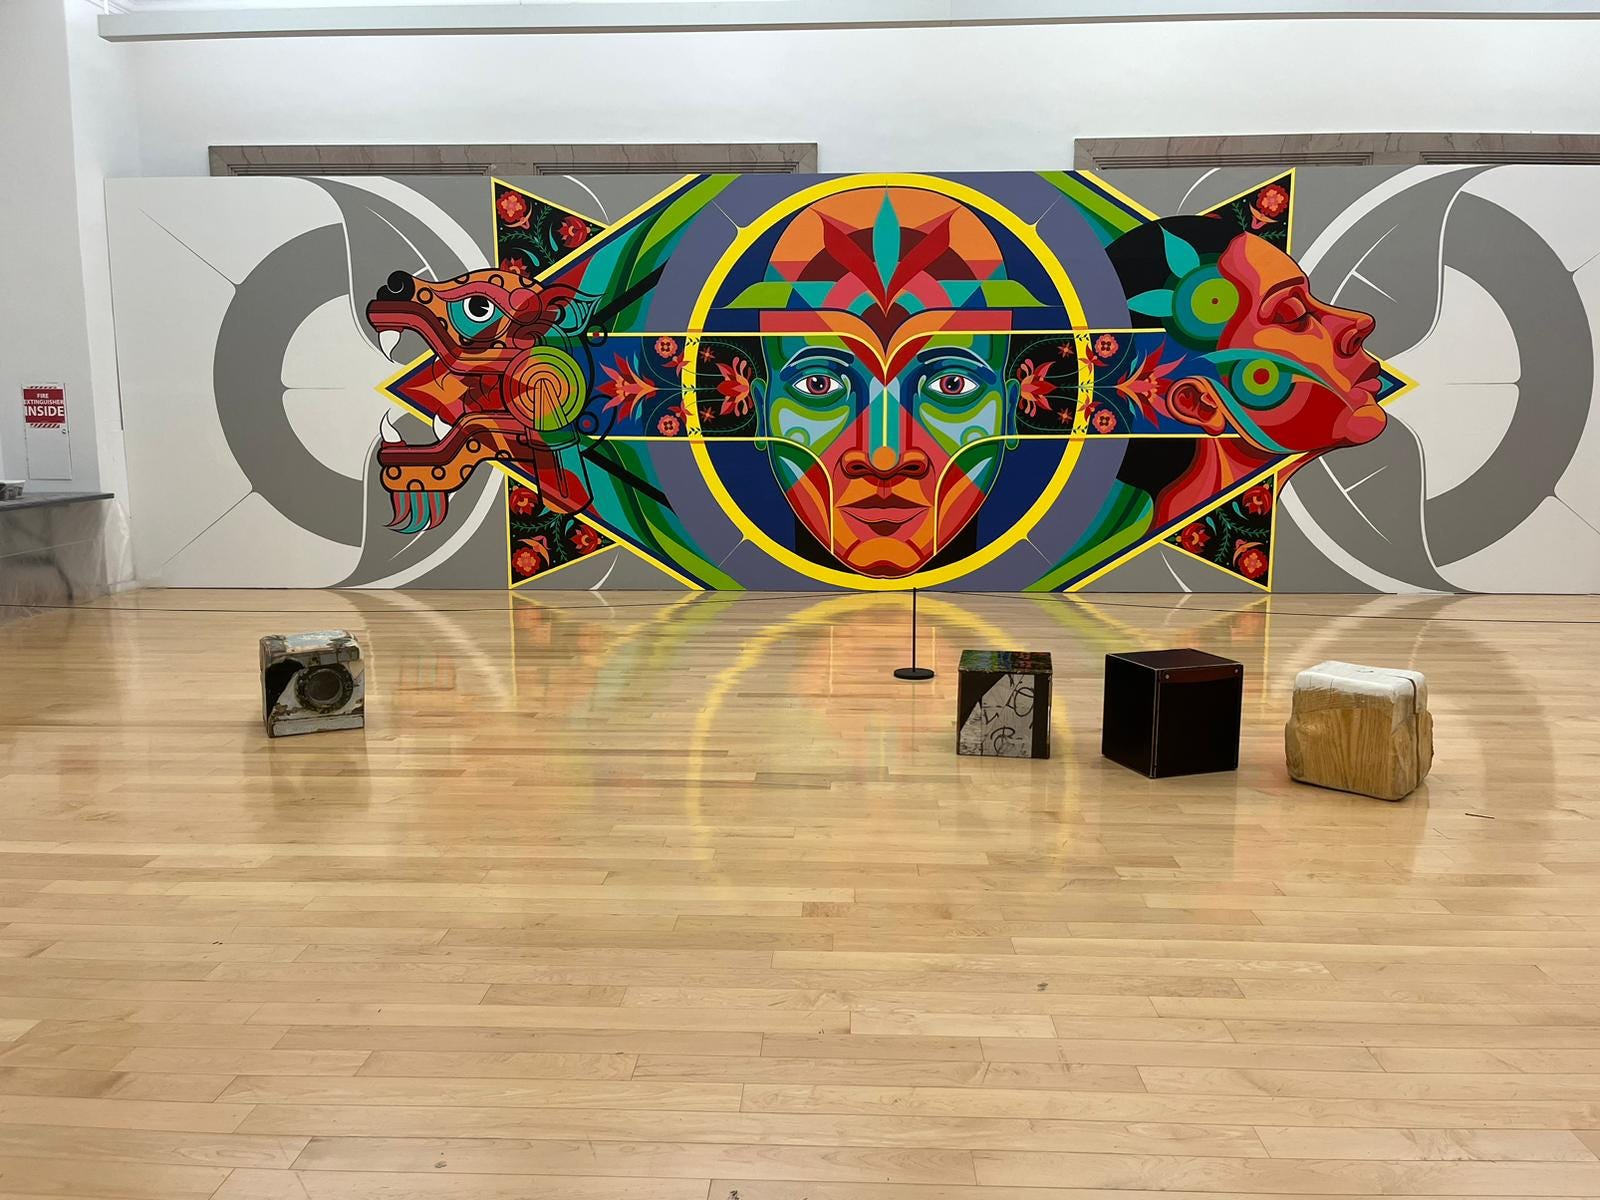
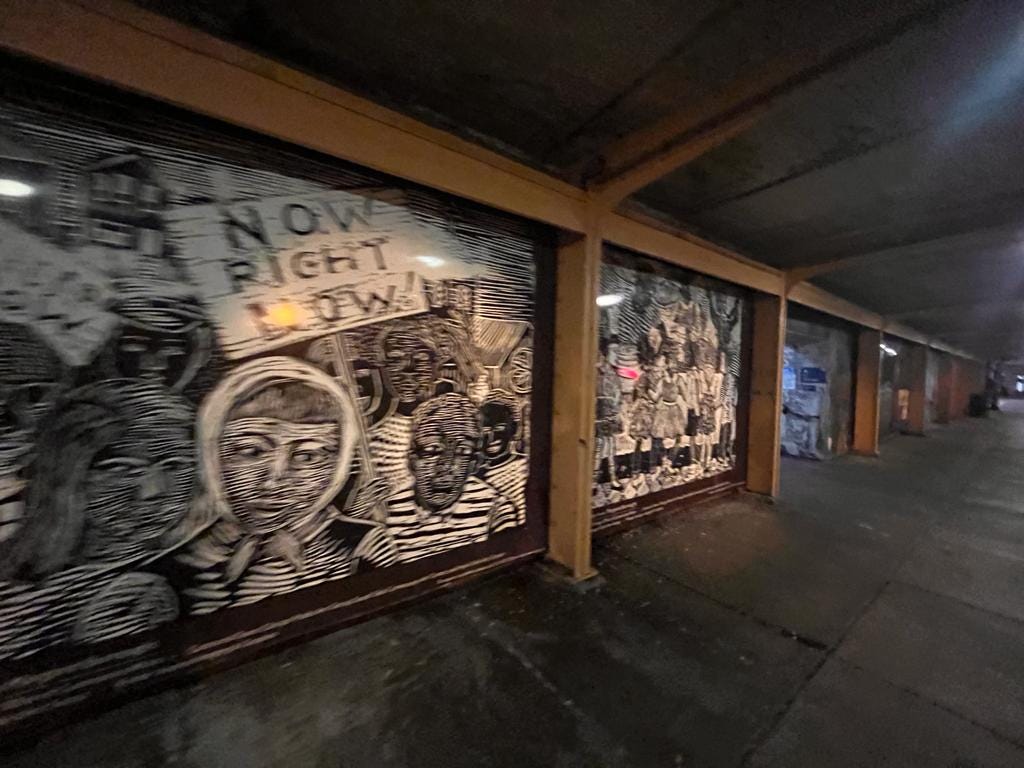
In the meantime, you can enjoy some of the pictures of the murals that I have seen around the neighbourhood. And also drop by to say hi if you are close-by :)

If you liked the post, please hit the like button so that more people get to discover it!